Graph Theory Basics
What are Graphs?
Imagine a network of cities connected by roads. In graph theory, we turn this into a simplified model:
-
Cities become vertices (or nodes): These are just dots representing the objects.
-
Roads become edges: Lines connecting the dots show relationships between the objects.

Graphs help us model all sorts of things: social media networks (people are nodes, friendships are edges), molecule structures, or even the layout of a website.
Types of Graphs
- Directed vs. Undirected:
- Undirected: Roads are two-way streets (think friendship on Facebook).
- Directed: Roads are one-way streets (think following someone on Twitter).
- Undirected: Roads are two-way streets (think friendship on Facebook).
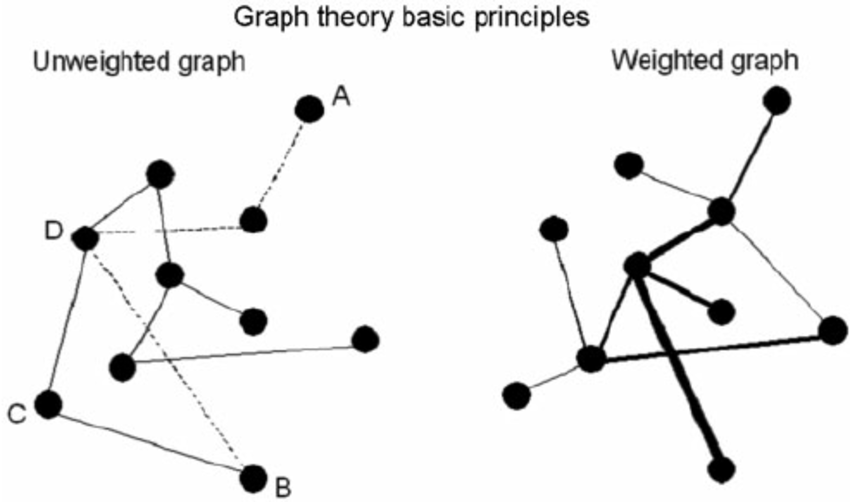
- Weighted vs. Unweighted:
- Unweighted: Roads are all the same; edges simply show if a connection exists.
- Weighted: Roads have distances or costs (think airline routes).
Key Concepts
-
Degree of a Vertex: How many edges are connected to a single vertex (how many roads lead to a city).
-
Path: A sequence of vertices connected by edges (like a route you’d take traveling between cities).
-
Cycle: A path that starts and ends at the same vertex (imagine a roundtrip road trip).
Representing Graphs
To work with graphs in computers, we need ways to store their structure:
-
Adjacency Matrix: Think of it as a table: Imagine you have a small town with four streets (let’s call them A, B, C, and D). Here’s how an adjacency matrix would represent which streets connect:
``` A B C D A 0 1 0 1 B 1 0 1 0 C 0 1 0 1 D 1 0 1 0 ```- Table Layout: The top row and the leftmost column list the street names.
- Reading the Matrix: If there’s a ‘1’ at the intersection of a row and column, there’s a connection.
- Example: Street ‘A’ is connected to street ‘B’ (row ‘A’, column ‘B’ has a ‘1’).
- Example 2: Street ‘B’ is NOT connected to itself (row ‘B’, column ‘B’ has a ‘0’).
Visualizing the Adjacency Matrix Adjacency List
Think of it like each street having a list of its “neighbors”:
- A: [B, D]
- B: [A, C]
- C: [B, D]
- D: [A, C]
Visualizing the Adjacency List Which is Better?
- Adjacency Matrix:
- Fast to check if a specific connection exists (just look up the cell).
- Can waste space if there are few connections (lots of ‘0’s in a big table).
- Adjacency List:
- More space-efficient for graphs where most things aren’t connected to each other.
- Slower to check for specific connections (have to search through lists).